The BBC news website has an article about how western demand for food and goods drives water shortages in developing countries. The interactive visual below is included. The problem I have with it is that the data just doesn't seem believable - I'm not saying it isn't true at all, just that when you deliver information with surprisingly high values (10,850 liters to produce a pair of jeans), you have to delve into that data to stop people instantly dismissing it. For example, how is that volume distributed over growing cotton, manufacture, and transportation? Are you including the water usage of the workers who have some involvement in the trade - is that a fair thing to include?
Without context, information becomes devalued, especially when the data seems outlandish (but may in fact be accurate).
I encountered some skepticism after writing a report concerning excess costs in U.S. shift work operations. The $206 billion annual lost opportunity seemed very high, but the methodology and charts that supported the conclusions made believers, I hope, of the listeners on NPR's Talk of the Nation, and readers of the print publications who picked up the story.
Do you have believability problems with the data in your company - is it being delivered to the decision makers effectively through dashboards and interactive reports? I can solve your data visibility problems and make your business run more efficiently and profitably.
Showing posts with label Data Visualization. Show all posts
Showing posts with label Data Visualization. Show all posts
19 April 2010
23 February 2010
Tableau Public. Cost of raising a child (controlling for inflation)
The Guardian newspaper in the UK often posts interesting data for its readers to mess with and comment on. The latest on the DataBlog ("where facts are sacred") is a data set showing how the cost of raising a child has increased in the UK by 43% since 2003.
The data is from an insurance company, Liverpool Victoria. In neither this data article or the main editorial is the method of data collection described. It's essential to describe this - A lack of visibility into methods, however reliable the reporting source, should quickly lead you to question the findings.
The other issue is that the costs don't seem to have been adjusted to changes in the value of currency (be that through inflation or other methods). Any time monetary values are shown on a time-axis spanning more than a few months (under normal inflation values), the values should be normalized to a single point.
This is my take on the data using Tableau Public, I have presented both the non adjusted costs, and the costs adjusted using the UK's consumer price index. The best normalization probably would be to median wage after tax, as these truly reflect the ability to pay for raising a child, but the CPI will at least give a more balanced view. You can see that the actual increase is about 22% from 2003, and that the only real contributors to this are childcare and education costs because they have increased the most above CPI, and they are the majority of the expenses. The problem with using CPI is that if you used a fine enough detail (e.g. the CPI of providing childcare), the results should, of course, be flat. This is why choosing how to deal with costs and time is far from straightforward.

Concerning my continued engagement with Tableau Public - it took a while to get the charts how I wanted them - I'm still on an enjoyable learning curve with the new software. There are a few bugs to iron out - for example it doesn't handle null values in an expected way (treats them as zero) - maybe that's still higher up on my learning curve..
The data is from an insurance company, Liverpool Victoria. In neither this data article or the main editorial is the method of data collection described. It's essential to describe this - A lack of visibility into methods, however reliable the reporting source, should quickly lead you to question the findings.
The other issue is that the costs don't seem to have been adjusted to changes in the value of currency (be that through inflation or other methods). Any time monetary values are shown on a time-axis spanning more than a few months (under normal inflation values), the values should be normalized to a single point.
This is my take on the data using Tableau Public, I have presented both the non adjusted costs, and the costs adjusted using the UK's consumer price index. The best normalization probably would be to median wage after tax, as these truly reflect the ability to pay for raising a child, but the CPI will at least give a more balanced view. You can see that the actual increase is about 22% from 2003, and that the only real contributors to this are childcare and education costs because they have increased the most above CPI, and they are the majority of the expenses. The problem with using CPI is that if you used a fine enough detail (e.g. the CPI of providing childcare), the results should, of course, be flat. This is why choosing how to deal with costs and time is far from straightforward.
Concerning my continued engagement with Tableau Public - it took a while to get the charts how I wanted them - I'm still on an enjoyable learning curve with the new software. There are a few bugs to iron out - for example it doesn't handle null values in an expected way (treats them as zero) - maybe that's still higher up on my learning curve..
17 February 2010
Swivel: First impressions
It would be remiss of me not to also review Swivel, another online, chart sharing solution, similar to Many Eyes, but not as fully-fledged as Tableau Public. One thing I immediately liked were the built-in connections to data sources. Within two clicks I was able to extract data from my Google Analytics account. Swivel then creates a default report from these data - that part wasn't so great - it seemed to be a mash-up of every chart type possible with color distributed with wild abandon.

The default view notwithstanding, there are nice editing options for the charts - the tooltips and visual clues about individual data points are very good. The chart options are the standard basic types, and I feel that Swivel is a quick way to throw a bar chart or pie up onto a website. There are no ways to interact with the data to the same extent you can with Many Eyes (I'm not going to compare Swivel to Tableau - they are completely different animals). The method of embedding is much nicer than Many Eyes, making the chart look much more part of your website and not requiring Java. See below for an example (not my chart).

The default view notwithstanding, there are nice editing options for the charts - the tooltips and visual clues about individual data points are very good. The chart options are the standard basic types, and I feel that Swivel is a quick way to throw a bar chart or pie up onto a website. There are no ways to interact with the data to the same extent you can with Many Eyes (I'm not going to compare Swivel to Tableau - they are completely different animals). The method of embedding is much nicer than Many Eyes, making the chart look much more part of your website and not requiring Java. See below for an example (not my chart).
16 February 2010
Normalizing data: Haiti donations by country using Many Eyes
Two things to talk about in this post - I continue my ramblings about the online viz tool Many Eyes, and discuss how normalizing data can provide radically different insights into data.
The data set I'm using is the donations by countries (government and corporations, but not private) to earthquake relief in Haiti. I've seen a few charts around this showing how the US has provided the most funding, but when normalized per capita, Canada and other countries stand out. On a purely data level, and not to denigrate any country's assistance, is this normalization appropriate when the donation sums do not include donations by the public?
Instead it may be more appropriate to normalize by gross domestic product, especially as governments and corporations greatly influence GDP. However, even that's not straightforward as GDP is affected by exchange rate and does not reflect purchasing power within a country. So we could also normalize based on GDP expressed as purchasing power parity, where differences in cost of living are accounted for.
This yields grossly different results, as shown below. I've made all of the bars in each series relative to the largest in that series. Guyana's contribution of a million dollars is massive compared to its GDP expressed in either way, dwarfing other countries' equivalent contributions. This shows that normalization, which is often appropriate, should be chosen carefully and assessed fully when interpreting charts.
Now onto Many Eyes - I've kept the visualization local again, so apologies for those reading without java. I like the result - it was certainly quick to produce and you can play around a little with it. It's not perfect though - to get appropriate height bars meant messing around - I couldn't get a scale to appear on the y-axis. For simple data, especially text based, I think Many Eyes excels, but this would have worked better in Tableau Public.
What I would love to have done would be to have shown this information as cartograms where the area a country occupies on the map is relative to the data value, not land mass. This would have added a visual geographical spin on where donations were coming from, especially for those of us who may have forgotten where Guyana is exactly..
The data set I'm using is the donations by countries (government and corporations, but not private) to earthquake relief in Haiti. I've seen a few charts around this showing how the US has provided the most funding, but when normalized per capita, Canada and other countries stand out. On a purely data level, and not to denigrate any country's assistance, is this normalization appropriate when the donation sums do not include donations by the public?
Instead it may be more appropriate to normalize by gross domestic product, especially as governments and corporations greatly influence GDP. However, even that's not straightforward as GDP is affected by exchange rate and does not reflect purchasing power within a country. So we could also normalize based on GDP expressed as purchasing power parity, where differences in cost of living are accounted for.
This yields grossly different results, as shown below. I've made all of the bars in each series relative to the largest in that series. Guyana's contribution of a million dollars is massive compared to its GDP expressed in either way, dwarfing other countries' equivalent contributions. This shows that normalization, which is often appropriate, should be chosen carefully and assessed fully when interpreting charts.
Now onto Many Eyes - I've kept the visualization local again, so apologies for those reading without java. I like the result - it was certainly quick to produce and you can play around a little with it. It's not perfect though - to get appropriate height bars meant messing around - I couldn't get a scale to appear on the y-axis. For simple data, especially text based, I think Many Eyes excels, but this would have worked better in Tableau Public.
What I would love to have done would be to have shown this information as cartograms where the area a country occupies on the map is relative to the data value, not land mass. This would have added a visual geographical spin on where donations were coming from, especially for those of us who may have forgotten where Guyana is exactly..
15 February 2010
Words on my blog: Many Eyes Viz
I'm playing around with Many Eyes - they have some nice text based visualizations. I'll be looking at their charting options as well. Here's a cloud of words on my blog.
I wish that it would appear a little more embedded - i.e. lose the menu at the top and not be grayed out to begin with.
I wish that it would appear a little more embedded - i.e. lose the menu at the top and not be grayed out to begin with.
12 February 2010
ER visits due to consumer products: Tableau Public
Tableau Software has just released Tableau Public - a free version of their data visualization tool that will revolutionize how we show information. To showcase its abilities I created the visualization linked below. WARNING: I wanted to push the limits of Tableau - there are 98,000 rows of data shown on the chart, so give it some time to load.
About the data: The NEISS is a database of emergency room visits that involve consumer products collected from 100 hospitals across the country. This is the latest dataset available and covers the entirety of 2008. There were about 370,000 visits in that time frame to these hospitals. As Tableau Public only allows 100,000 rows of data, I used a random function to reduce the dataset.
Using the Visualization: Shown are the 98,000 cases, plotted on the y-axis by age of the patient, and categorized by the type of injury. The lines are colored by body part affected. By default, every product involved is shown. Use the filter on the right to select just a few. For example, deselect "all", and use the magnifying glass to search for just chain saws, select that product, and allow the chart to update. If you mouse over an individual case, you can see the narrative entered by the hospital about the accident.
The chart provides some information about age spread, and the incidence of a particular type of injury, while still allowing you to look at individual cases. I intend to do a lot more with Tableau and this data set - stay tuned for some dashboards. Click the image to interact with the data.

I'm betting your company has data that you'd like to know more about. Data Driven Consulting specializes in collecting, cleaning, and presenting data just like the example above.
About the data: The NEISS is a database of emergency room visits that involve consumer products collected from 100 hospitals across the country. This is the latest dataset available and covers the entirety of 2008. There were about 370,000 visits in that time frame to these hospitals. As Tableau Public only allows 100,000 rows of data, I used a random function to reduce the dataset.
Using the Visualization: Shown are the 98,000 cases, plotted on the y-axis by age of the patient, and categorized by the type of injury. The lines are colored by body part affected. By default, every product involved is shown. Use the filter on the right to select just a few. For example, deselect "all", and use the magnifying glass to search for just chain saws, select that product, and allow the chart to update. If you mouse over an individual case, you can see the narrative entered by the hospital about the accident.
The chart provides some information about age spread, and the incidence of a particular type of injury, while still allowing you to look at individual cases. I intend to do a lot more with Tableau and this data set - stay tuned for some dashboards. Click the image to interact with the data.
I'm betting your company has data that you'd like to know more about. Data Driven Consulting specializes in collecting, cleaning, and presenting data just like the example above.
7 February 2010
Data visualization challenge: my dashboard design
Finally we get to the choices I made for my dashboard entry into Chandoo's data visualization challenge. The challenge already directed us to make the dashboard focused on the two year performance of the sales people. I'll break this post into the five or so parts of the (single screen) dashboard.
 Easily overlooked, but vital, is the title of the dashboard - what is it, what time period does the data cover? Under the title is the most expensive part of the screen real estate - the primary information must go here. If I'm a senior manager looking for sales person information, my first questions will always be: who sold the most, how did those sales vary over my chosen time period, how much was sold compared to what was expected?
From this display we see immediately who sold the most and the least - give the dollar values, they will be needed - the bar chart gives us information about each person's contribution to the sum. The red markers warn of poor sales performance. The sparklines provide us with time trending information, so often missed from data displays. For data that has some sort of periodicity (as sales data tends to), it can be useful to provide a moving average that better reveals overall trends - for example, the moving average is better at showing that everyone experiences a drop in sales part way through the period, but Hansolo's drop was much more abrupt than James Kirk's.
The Budget/Actual shows that only Hansolo met budget, presumably due to the recovery he experienced in the last six months. By not scaling the bars to be all 100%, we provide additional information about what the sales targets were per sales person. As this makes it difficult to compare sales to target across the sales force, the variance to budget bars clarify this.
 The sparklines in the top section are scaled differently to each other - otherwise trends are hidden for the sales people with lower revenue. However it would be easy to predict that the user of the dashboard would want to see the information on one chart. The chart provides this, and an in an effort to minimize colors I added a drop down box to highlight one person compared to the other three. When the manager asks "Why was Hans Solo's performance better than the others?" this chart helps answer that.
I feel that the headlines section is an often overlooked part of a dashboard- 3D pie charts and revving speedometers are sexy, words are not. Often though, pithy statements can make a dashboard much more useful and in 20 seconds can provide you with the most important take-home messages. They are especially great in dynamic dashboards, as long as the information regularly changes.
 Finally we begin to get to the other measures that perhaps (hopefully) help us understand the sales issues. The coloration on the data table (again, it is important to sometimes show values) helps us understand the areas that sales people sold in - James Kirk sold almost exclusively in the south, Luke sold across the country. The map provides this information in a slightly different way - for a given region, who sold the most?
The map also provides information about the states that are in each region - anyway that you can make a dashboard as rich as possible is great, but notice that as this is not the most important information, the region boundaries are just a thicker gray, not a highly colored boundary that detracts from the bars.

The bottom two displays are formatted in the same way, so here is just the company size visualization. The stacked bar shows the proportion of sales to each size company - Chewbacca sells to all sizes, Luke is much more focused on enterprise sales. The bars underneath show for a particular size company, how are the sales distributed - again, important, because even though Chewabacca sells to enterprise, his overall contribution to the sales for that size company is completely minimal. That's it - thank you again Chandoo, for the opportunity to create this dashboard.
If by some amazing chance you've made it all the way through this post and are still reading, I'd like to remind you that Data Driven Consulting can help your organization create actionable, strategic, highly useful dashboards and reports that will make your business more successful.
From this display we see immediately who sold the most and the least - give the dollar values, they will be needed - the bar chart gives us information about each person's contribution to the sum. The red markers warn of poor sales performance. The sparklines provide us with time trending information, so often missed from data displays. For data that has some sort of periodicity (as sales data tends to), it can be useful to provide a moving average that better reveals overall trends - for example, the moving average is better at showing that everyone experiences a drop in sales part way through the period, but Hansolo's drop was much more abrupt than James Kirk's.
The Budget/Actual shows that only Hansolo met budget, presumably due to the recovery he experienced in the last six months. By not scaling the bars to be all 100%, we provide additional information about what the sales targets were per sales person. As this makes it difficult to compare sales to target across the sales force, the variance to budget bars clarify this.
I feel that the headlines section is an often overlooked part of a dashboard- 3D pie charts and revving speedometers are sexy, words are not. Often though, pithy statements can make a dashboard much more useful and in 20 seconds can provide you with the most important take-home messages. They are especially great in dynamic dashboards, as long as the information regularly changes.

The map also provides information about the states that are in each region - anyway that you can make a dashboard as rich as possible is great, but notice that as this is not the most important information, the region boundaries are just a thicker gray, not a highly colored boundary that detracts from the bars.
The bottom two displays are formatted in the same way, so here is just the company size visualization. The stacked bar shows the proportion of sales to each size company - Chewbacca sells to all sizes, Luke is much more focused on enterprise sales. The bars underneath show for a particular size company, how are the sales distributed - again, important, because even though Chewabacca sells to enterprise, his overall contribution to the sales for that size company is completely minimal. That's it - thank you again Chandoo, for the opportunity to create this dashboard.
If by some amazing chance you've made it all the way through this post and are still reading, I'd like to remind you that Data Driven Consulting can help your organization create actionable, strategic, highly useful dashboards and reports that will make your business more successful.
Design (in)considerations
A slideshow of some bad design examples I've been collecting. My favorites are the French translation making you find a 3.17mm drill and the chair that's not a chair..
21 January 2010
Data visualization challenge: the objective
This is the second part of designing my dashboard for the viz challenge at Chandoo.com. With the raw data ready to tell a story, it was time to understand what the objective was. Unfortunately many dashboards/data displays are so immersed in either the technology or the ability to create pretty things (3D pie charts and revving gauges) that this most important part is overlooked. From the challenge our mission was to:
 There are three keys here to achieving the goal: senior - someone high up in the company who has little time to be delving into information - they want the information fast and they want to know what caused the issues they are seeing.
Sales people - they want to know about the performance of the sales people - all of the measures and charts should be centric to these sales people, or at least explain the performance of these sales people.The very first measures shown should describe the sales performance alone.
24 months - he/she is clearly interested in the time trending information - how the sales people have performed over the two year period.
Now in most situations, an objective is rarely as well defined as that - it is the job of the product owners to ensure clarity like this is reached. Is this a one-off? Who will be using it? What do they care about in this instance? How timely does the data need to be? From there you can move to the measures displayed..
"help a senior manager understand how the sales people have done in the 24 months"
 There are three keys here to achieving the goal: senior - someone high up in the company who has little time to be delving into information - they want the information fast and they want to know what caused the issues they are seeing.
Sales people - they want to know about the performance of the sales people - all of the measures and charts should be centric to these sales people, or at least explain the performance of these sales people.The very first measures shown should describe the sales performance alone.
24 months - he/she is clearly interested in the time trending information - how the sales people have performed over the two year period.
Now in most situations, an objective is rarely as well defined as that - it is the job of the product owners to ensure clarity like this is reached. Is this a one-off? Who will be using it? What do they care about in this instance? How timely does the data need to be? From there you can move to the measures displayed..
20 January 2010
Data visualization challenge results, part one: addressing the data

Chandoo provided us with a data file containing two years of raw revenue data for four sales people with information on sales per region, product, and size of company sold to.
Chandoo created the data to show steady growth over the two years, with a little bit of randomness thrown in. As this didn't perhaps allow for an interesting story we were allowed to change the data, but not to add new columns of data (e.g. profit, expenses). Generating data to tell a story is harder than is sounds, especially when you want there to be reasons why one person wasn't performing as well. While this seems a little involved for an online competition, it was very similar to the thinking you would have to do anyway when designing dashboards - "of the available data, what is the most important to show to the specific end-user for this situation, what can be compared to what to give insight into these data?"
Real data would usually reflect these insights, so I felt I had to make the data more real. I started with stories about the sales, for example: like most sales data, it fluctuates on an X month cycle as sales targets are set and deadlines approach, all the sales people suffered late 2008 due to the recession, some experienced a more abrupt drop in sales, some recovered quicker, Chewbacca (seriously) sells more in the East region, but across all company sizes, Luke Skywalker sells across the country, but mostly to the larger customers.
 You can see what I did here (xls 2003) to create the data (second sheet, at the bottom). I created data for the regions that described an overall pattern. From there I created modifiers based on who sold what where, and placed a variable that influenced how strongly these modifiers altered the sales data. With the addition of the Index function, multiple if statements, and randomness thrown in, the data was created. It certainly isn't elegant - I'm sure that it could have been much more concise and still told the stories I wanted, but it worked. Next up: designing the dashboard for the end-user.
19 January 2010
Taming the Data Dragon
Thanks to @infoholic on Twitter for bringing this little gem to my attention: "Daddy, what do you do at work?"
8 January 2010
Animated visualizations: Don't change the scale!!
 I have an unhealthy obsession with weather - partly because we heat with wood, and partly because if it snows enough I get to use the snowblower on the front of my lawn tractor. Consequently I often have the weather radar up on my browser.
By default, wunderground.com (and most others) show only the most current radar image - other than a total storm size I can pretty much look out of my window to get the same information.
By animating the map, I can see direction of movement - key if you are at the edge of the storm, and very important if it's a coastal storm which tends to sit and rotate rather than moving off. Equally I get to see the speed of the storm's movement, another important variable, and how the intensity of the storm is changing, denoted by the key on the right.

The initial scale has a number of shades of grey below zero (that really could be replaced with just one color, as this just means clouds with some snow blowing around).
5dBZ on the first scale (light snow) is a dark green. As the intensity of the storm passes a threshold a switch is made to the second scale. Now anything below 10dBZ is light grey, and interestingly, as is anything above 60dBZ. The second scale now also has some descriptions of the intensity. The new scale fails color blind users to a certain degree (mouseover to see) - the 45dBZ plus now looks very much like 15dBZ.

This isn't wunderground.com's fault - I would guess they pull the images from NOAA. I would also venture to guess the change in scale is as a result of the internal workings of the radar changing. Whatever the reason, software creates the scale, so it could be fixed.
One fix: as a change in scale is needed, create two images, one with the old scale, one with the new, for the period of time that that the animation covers. When you have enough frames switch over so that the animation only uses one scale. This isn't a great fix as that scale change will still confuse when viewing over longer time periods or intermittently through the day.
Much better would be to just have one scale (right) - as a member of the public (rather than a pilot for example), I don't think the values below 0dBZ, or above 65dBZ, mean much to me, so you could probably lump all of those into a bucket or two. I've still used a green to red scale, but identified the 'catch all' buckets at the top and bottom with colors outside the gradient. I've also extended the color range through purple. The greens have a lot more blue in them to help colorblind users (mouseover). A few other improvements - specify time between frames so that I can understand velocity (I always have to try to catch what the clock movements are), and state when the most recent picture was taken (not just the time of the current frame).
5 January 2010
Exploring crash statistics - an excellent interactive visualization

The year slicer on the bottom is excellent, allowing you not only to quickly jump between years, but also to see how accidents vary over the months in each year. My only wish is that you could show the markers for all years, allowing you to better identify accident hotspots, and that they superimposed a line across years to show a trend of total accidents.
On another tab, they have the breakdown of accidents by time of day. The buttons on the side allow you to see the pie chart and time of day statistics by the category chosen. A pie chart is not my first choice here - a bar chart would be better, but you can click a section of the pie to show the time of day data by just that segment - mouseover the image below to see when young people kill themselves vs. the older population. I think the radial bar chart works very well in this case, especially with the radial gridlines.

In a previous career I was a consultant focusing on fatigue and safety, so these data are of particular interest to me - for example, if you select vehicles, then the pie segment for goods vehicles, you can see the spike in accidents at 4AM as truckers fall asleep at the wheel and crash. The only thing missing (which you rarely see in data like these) is normalization - the risk of driving in the early hours is so much greater than at other times of the day considering the amount of traffic. An excellent example of data visualization.
29 December 2009
What will the third dimension bring to data visualization?

The concept of 3D TVs is beginning to take off, with many vendors pushing 3D-ready sets. While glasses-less 3D is a way off, I wonder how this will affect 'standard' data visualizations - I'm not sure that a bar chart with data on a Z-axis that you can actually look around by moving your head, will be much better than the fake 3D ones today that you can rotate around with your mouse.
Perhaps we will start to see 'Sparksurfaces™' instead of 'Sparklines' - move your head to see the data plotted against another variable. I have a suspicion that there won't be any great advances in data visualization, rather we will see even slicker, eye-popping dashboards and charts that may, or may not, be easier to read. Your thoughts?
18 December 2009
#uksnow - plotting Tweets on a map
 The UK is currently having its once every ten years snowfall. Like many places that rarely get snow, this is not only a big deal, but makes travel near impossible. There will be SUVs littering the ditches by day break.. What has been interesting is watching how social media reports this - one person has taken this further and is plotting tweets of snow reports - users tweet their postcode and on a scale of 0 to 10, how much snow is coming down.
While it a great example of what can be done with clever programing and social media, especially during an unusual event, the actual visualization produced isn't very useful - there's no indication of the age of the tweets - i.e. whether this reflects the last 10 minutes or the last day. This is important especially when the data will vary greatly from hour to hour - "how much snow is falling now".
When data is plotted that has any time component, you need to indicate the 'freshness' and the 'aging'. Also, there isn't any normalization for number of users - so London looks like a hot bed of snow activity. If this were something more serious, a better way to represent this would be to break the country down into less discrete areas (e.g. counties), and color these based on snow reports, rather than plotting individual tweets. This would reduce the influence that number of tweets has on the look of the map. Areas where there was no data would have to be able to be distinguished from areas of no snow.
Even better would be to have an animate option where you could watch the progress of snow fronts across the country over the last day. Still, I like it - imagine doing this with power outages during an ice storm (updates via phones I suppose), progress of wild fires, etc. There could be some really useful information as long as enough people take part.
11 December 2009
Where in the world (are pie charts popular)?

While I was just using these terms to get a data set, this information is actually also interesting - Relative to all searches in a country, India's users are twice as likely to be searching for either pie chart or bar chart. Does this mean that India has more studious users while US users are occupied by searching for the latest Tiger Woods news? I don't know how language is accounted for - if the normalization just for searches in a single language this would explain the difference, as English language searches would more likely to be conducted by business users. This brings up an important point about knowing exactly how data is 'manipulated' prior to drawing any sweeping conclusions.
I've added a second series (green dot) that compares the relative popularity of bar vs. pie (pie chart popularity/bar chart popularity) within a country. Interestingly, "bar chart, is almost searched for as often as "pie chart" in India, the Philippines, etc. compared to the US, where "bar chart" is half the search volume of "pie chart". Go draw your own conclusions about that.
7 December 2009
Visualizing data that obscures trends (pie charts are "better")
I've been playing around with Google trends for a while now. It's an incredibly powerful tool for market research, especially when you're looking at new markets, or how the popularity of a brand is changing. You can look at how a particular search term has trended over five years, where the term is more popular (countries, cities), compare several search terms, and how news stories that bear relevance to the search terms may have impacted the search volume.
The search terms I chose to compare for this example were "pie chart" and "bar chart", partially in response to the friendly back and forwards that Chandoo and Jon Peltier have had recently concerning appropriate use of pie charts. My data adds nothing to their conversation apart from what the public considers 'search worthy', so apologies for the misleading blog title, but the data are perfect for demonstrating how you can better visualize data that have seasonal and other variations that hide overall trends.
 Here are the data - relative search popularity of the two terms on a week to week basis since 2004. Some things come out immediately - people search for pie charts more than they search for bar charts. There seems to be seasonal variation within each year, and there seems to be a trend over the years. To investigate these trends further I summarized data by month/year/etc. by grouping the dates in pivot charts.

Here's the seasonal variation - taken by looking at the average search popularity by month of the year, across all five years. Both terms are searched for less in the summer (for the northern hemisphere, but the data are overwhelmingly dominated by users in this hemisphere), and at the end of the year. This would coincide with both school holidays and lower business search volume (as people take vacations). The lines suggest that "bar chart" is less affected during the summer than "pie chart". To confirm this, I've added another series that compares how the two terms vary compared to each other. If the bar for a month is lower than 1, "bar chart" has dropped less relative to its average popularity over the year when compared to "pie chart", so yes, even when you account for the fact that absolute height variation of "pie chart" is greater, "bar chart" does not experience as great a drop-off mid-year.
As a nod towards the bar-chart vs. pie chart argument, perhaps one could argue tongue-in-cheek that "pie chart" is searched for by school children more than business users as the drop-off is larger in the school summer vacation, so therefore bar charts must be more important to business.. No, probably not.
Before we move on though, a quick comment on what we've lost from the 'raw' data. From our summary chart you could conclude that the search volume is about the same in December as it is in the summer months. However, look at the top chart - search volume only drops in December in the last two weeks of the month, whereas search volume is lower for every week of July. For that reason, you must carefully consider the level of summary you chose, whether an average or sum is better for comparisons, and whether you should also show the raw data.

Next we have year to year variation. There is a dip in 2006 and 2007 (for which I have no explanation..) The pattern is the same for bar and pie searches. It is likely to be a reflection of real search volume, not a collection artifact, because two unrelated search terms do not show this dip. I wondered if "bar chart" was catching up to "pie chart", so the line compares the absolute difference. Interestingly, without the average line plotted across, it really looks like this line is dropping - "bar chart" is catching "pie chart" up, but it's misleading - because both the other lines are headed upwards, even a straight-ish line looks like it's dropping. The addition of the straight average line reveals that there is little, if any catching up being done.
Similarly to the prior chart, you have to be mindful of what you've lost in this summary. If you use an absolute count of searches, rather than an average then the results will be different to some degree (and not only because we are missing December 2009 data).
I did also plot these data by day of the month - searches are more slightly popular towards the beginning of a month, but I would attribute that to the two main US holidays, Thanksgiving and Christmas, both occurring the later parts of the month.
How else could you summarize these data?
The search terms I chose to compare for this example were "pie chart" and "bar chart", partially in response to the friendly back and forwards that Chandoo and Jon Peltier have had recently concerning appropriate use of pie charts. My data adds nothing to their conversation apart from what the public considers 'search worthy', so apologies for the misleading blog title, but the data are perfect for demonstrating how you can better visualize data that have seasonal and other variations that hide overall trends.
 Here are the data - relative search popularity of the two terms on a week to week basis since 2004. Some things come out immediately - people search for pie charts more than they search for bar charts. There seems to be seasonal variation within each year, and there seems to be a trend over the years. To investigate these trends further I summarized data by month/year/etc. by grouping the dates in pivot charts.

As a nod towards the bar-chart vs. pie chart argument, perhaps one could argue tongue-in-cheek that "pie chart" is searched for by school children more than business users as the drop-off is larger in the school summer vacation, so therefore bar charts must be more important to business.. No, probably not.
Before we move on though, a quick comment on what we've lost from the 'raw' data. From our summary chart you could conclude that the search volume is about the same in December as it is in the summer months. However, look at the top chart - search volume only drops in December in the last two weeks of the month, whereas search volume is lower for every week of July. For that reason, you must carefully consider the level of summary you chose, whether an average or sum is better for comparisons, and whether you should also show the raw data.

Similarly to the prior chart, you have to be mindful of what you've lost in this summary. If you use an absolute count of searches, rather than an average then the results will be different to some degree (and not only because we are missing December 2009 data).
I did also plot these data by day of the month - searches are more slightly popular towards the beginning of a month, but I would attribute that to the two main US holidays, Thanksgiving and Christmas, both occurring the later parts of the month.
How else could you summarize these data?
30 November 2009
Charting data with one disproportionally large value
Datavis tweeted about a fun chart he found comparing 'kills' between the top animals - I'm not sure the data are meant to be real or what 'kills' means, but the point is made that humans are by far the worst offenders. Part of the emphasis is that the human number is literally 'off the chart'.
It got me thinking about how to show data like these - where you have one very large number and other much smaller numbers. There are two things that people may want to know- how much bigger the single point is than the others, and then how the others compare. I've thrown together a few ways you could do it:

Top left: default scaling - it certainly gets the point across that one value far eclipses the others, but you can't really compare the others, or put numbers to them.
Top right: log scale - often espoused as a solution, but frankly I can't stand it. Most people don't get log scales, and I find myself looking to the axis to compare values - I may as well just have the values in a table. It's also difficult to compare small differences between bars.
Middle left: breaking the axis - you can't really visually see how much bigger the human contribution is, but the point is made that it's much bigger, and you can still compare the smaller values. There is no way in Excel to do this automatically - you can limit the axis max of course, but there's no indication that the bar continues upwards.
Middle right: two charts - Arghhh, my eyes, a pie chart and some bevel effects. Actually I quite like this - pie charts are fine for comparing two values if you're not trying to read the exact comparison from them, though the numbers are needed. As for the bevel effect - I blame that on the excesses of Thanksgiving..
Bottom left: aspect ratio - simply enough, make the chart so long that you can compare the smaller values. Even on web only presentation this is a difficult one because of the real estate used up - that is, unless you use this space for other content.
Bottom right: just imply a continuation - similar to the broken axis, and similar to the original chart that Datavis tweeted, but with the actual value shown. Needless to say, this is not a default view in Excel..
Any comments on these, which is your favorite? How would you address this challenge for a dashboard vs. print publication?
It got me thinking about how to show data like these - where you have one very large number and other much smaller numbers. There are two things that people may want to know- how much bigger the single point is than the others, and then how the others compare. I've thrown together a few ways you could do it:

Top right: log scale - often espoused as a solution, but frankly I can't stand it. Most people don't get log scales, and I find myself looking to the axis to compare values - I may as well just have the values in a table. It's also difficult to compare small differences between bars.
Middle left: breaking the axis - you can't really visually see how much bigger the human contribution is, but the point is made that it's much bigger, and you can still compare the smaller values. There is no way in Excel to do this automatically - you can limit the axis max of course, but there's no indication that the bar continues upwards.
Middle right: two charts - Arghhh, my eyes, a pie chart and some bevel effects. Actually I quite like this - pie charts are fine for comparing two values if you're not trying to read the exact comparison from them, though the numbers are needed. As for the bevel effect - I blame that on the excesses of Thanksgiving..
Bottom left: aspect ratio - simply enough, make the chart so long that you can compare the smaller values. Even on web only presentation this is a difficult one because of the real estate used up - that is, unless you use this space for other content.
Bottom right: just imply a continuation - similar to the broken axis, and similar to the original chart that Datavis tweeted, but with the actual value shown. Needless to say, this is not a default view in Excel..
Any comments on these, which is your favorite? How would you address this challenge for a dashboard vs. print publication?
20 November 2009
Good charts and humor?
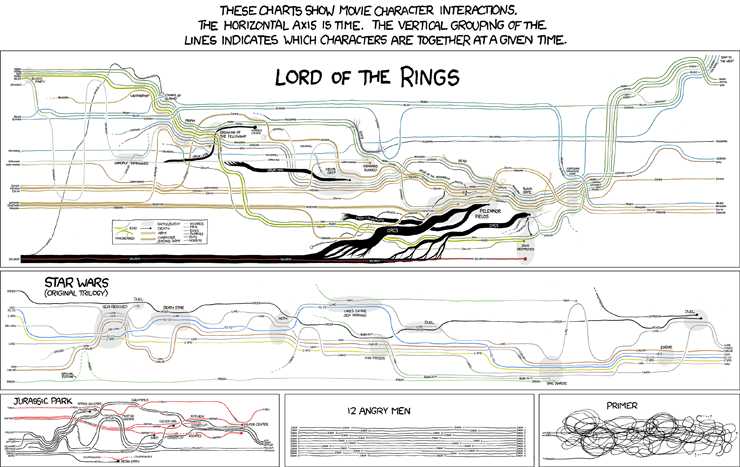
XKCD.com often delivers amusement, but now I get to include it on my business blog - look: charts and humor all in one place. Could it get any better (rhetorical).
18 November 2009
Insights by IBM

Is the 'chart' they show a result of not buying their software, or what you get when you do? I know it's just marketing fluff, but when you provide people with concepts like this, no wonder they are happy with revving gauges.
Actionable indeed...
Subscribe to:
Posts (Atom)


