Showing posts with label Good Examples. Show all posts

22 February 2010

What our kids are learning

Being in the data business, I tend to critique most charts or visualizations I see. I am pleased to note that not only is my son's kindergarten already pushing an understanding of data, but that so far the charts have all been of the bar variety.

While of course one could labor on the excessively strong grid lines reducing the data-ink ratio, I think I'll let it slide this time.

I do hope that pie charts aren't being reserved for 1st grade as they are "more advanced"..

If your business has data that you would like to know more about, maybe you need some bar charts hand crafted by me (or my son) with crayons, or possibly very robust tools like Tableau Public.

12 February 2010

ER visits due to consumer products: Tableau Public

Tableau Software has just released Tableau Public - a free version of their data visualization tool that will revolutionize how we show information. To showcase its abilities I created the visualization linked below. WARNING: I wanted to push the limits of Tableau - there are 98,000 rows of data shown on the chart, so give it some time to load.

About the data: The NEISS is a database of emergency room visits that involve consumer products collected from 100 hospitals across the country. This is the latest dataset available and covers the entirety of 2008. There were about 370,000 visits in that time frame to these hospitals. As Tableau Public only allows 100,000 rows of data, I used a random function to reduce the dataset.

Using the Visualization: Shown are the 98,000 cases, plotted on the y-axis by age of the patient, and categorized by the type of injury. The lines are colored by body part affected. By default, every product involved is shown. Use the filter on the right to select just a few. For example, deselect "all", and use the magnifying glass to search for just chain saws, select that product, and allow the chart to update. If you mouse over an individual case, you can see the narrative entered by the hospital about the accident.

The chart provides some information about age spread, and the incidence of a particular type of injury, while still allowing you to look at individual cases. I intend to do a lot more with Tableau and this data set - stay tuned for some dashboards. Click the image to interact with the data.


I'm betting your company has data that you'd like to know more about. Data Driven Consulting specializes in collecting, cleaning, and presenting data just like the example above.

7 February 2010

Data visualization challenge: my dashboard design

Finally we get to the choices I made for my dashboard entry into Chandoo's data visualization challenge. The challenge already directed us to make the dashboard focused on the two year performance of the sales people. I'll break this post into the five or so parts of the (single screen) dashboard.

Easily overlooked, but vital, is the title of the dashboard - what is it, what time period does the data cover? Under the title is the most expensive part of the screen real estate - the primary information must go here. If I'm a senior manager looking for sales person information, my first questions will always be: who sold the most, how did those sales vary over my chosen time period, how much was sold compared to what was expected?

From this display we see immediately who sold the most and the least  - give the dollar values, they will be needed - the bar chart gives us information about each person's contribution to the sum. The red markers warn of poor sales performance. The sparklines provide us with time trending information, so often missed from data displays. For data that has some sort of periodicity (as sales data tends to), it can be useful to provide a moving average that better reveals overall trends - for example, the moving average is better at showing that everyone experiences a drop in sales part way through the period, but Hansolo's drop was much more abrupt than James Kirk's.

The Budget/Actual shows that only Hansolo met budget, presumably due to the recovery he experienced in the last six months. By not scaling the bars to be all 100%, we provide additional information about what the sales targets were per sales person. As this makes it difficult to compare sales to target across the sales force, the variance to budget bars clarify this.

The sparklines in the top section are scaled differently to each other - otherwise trends are hidden for the sales people with lower revenue. However it would be easy to predict that the user of the dashboard would want to see the information on one chart. The chart provides this, and an in an effort to minimize colors I added a drop down box to highlight one person compared to the other three. When the manager asks "Why was Hans Solo's performance better than the others?" this chart helps answer that.

I feel that the headlines section is an often overlooked part of a dashboard- 3D pie charts and revving speedometers are sexy, words are not. Often though, pithy statements can make a dashboard much more useful and in 20 seconds can provide you with the most important take-home messages. They are especially great in dynamic dashboards, as long as the information regularly changes.

Finally we begin to get to the other measures that perhaps (hopefully) help us understand the sales issues. The coloration on the data table (again, it is important to sometimes show values) helps us understand the areas that sales people sold in - James Kirk sold almost exclusively in the south, Luke sold across the country. The map provides this information in a slightly different way - for a given region, who sold the most?

The map also provides information about the states that are in each region - anyway that you can make a dashboard as rich as possible is great, but notice that as this is not the most important information, the region boundaries are just a thicker gray, not a highly colored boundary that detracts from the bars.


The bottom two displays are formatted in the same way, so here is just the company size visualization. The stacked bar shows the proportion of sales to each size company - Chewbacca sells to all sizes, Luke is much more focused on enterprise sales. The bars underneath show for a particular size company, how are the sales distributed - again, important, because even though Chewabacca sells to enterprise, his overall contribution to the sales for that size company is completely minimal. That's it - thank you again Chandoo, for the opportunity to create this dashboard.

If by some amazing chance you've made it all the way through this post and are still reading, I'd like to remind you that Data Driven Consulting can help your organization create actionable, strategic, highly useful dashboards and reports that will make your business more successful.

30 November 2009

Charting data with one disproportionally large value

Datavis tweeted about a fun chart he found comparing 'kills' between the top animals - I'm not sure the data are meant to be real or what 'kills' means, but the point is made that humans are by far the worst offenders. Part of the emphasis is that the human number is literally 'off the chart'.

It got me thinking about how to show data like these - where you  have one very large number and other much smaller numbers. There are two things that people may want to know- how much bigger the single point is than the others, and then how the others compare. I've thrown together a few ways you could do it:


Top left: default scaling - it certainly gets the point across that one value far eclipses the others, but you can't really compare the others, or put numbers to them.

Top right: log scale - often espoused as a solution, but frankly I can't stand it. Most people don't get log scales, and I find myself looking to the axis to compare values - I may as well just have the values in a table. It's also difficult to compare small differences between bars.

Middle left: breaking the axis - you can't really visually see how much bigger the human contribution is, but the point is made that it's much bigger, and you can still compare the smaller values. There is no way in Excel to do this automatically - you can limit the axis max of course, but there's no indication that the bar continues upwards.

Middle right: two charts - Arghhh, my eyes, a pie chart and some bevel effects. Actually I quite like this - pie charts are fine for comparing two values if you're not trying to read the exact comparison from them, though the numbers are needed. As for the bevel effect - I blame that on the excesses of Thanksgiving..

Bottom left: aspect ratio - simply enough, make the chart so long that you can compare the smaller values. Even on web only presentation this is a difficult one because of the real estate used up - that is, unless you use this space for other content.

Bottom right: just imply a continuation - similar to the broken axis, and similar to the original chart that Datavis tweeted, but with the actual value shown. Needless to say, this is not a default view in Excel..

Any comments on these, which is your favorite? How would you address this challenge for a dashboard vs. print publication?

24 November 2009

Visually exciting and useful? Google's image swirl

When I find a new visualization or graphically based tool on the web, I like to jump straight in without looking at what it's supposed to do, or for that matter, how it's supposed to work.


Google's image swirl is superb - so obvious, and yet very useful. Search for an image - e.g. Statue of Liberty, and it gives you a selection of stacked images, with each stack having a different image characteristic - aspect ratio, colors, light level (night/day), for example. Select one of these and you can drill down further until you can get to a range of images that all are pretty similar, jump back up a level if you still want to refine it. In the example above I've navigated to pictures taken at day that also have nice fluffy clouds and the Statue of Liberty (or some interpretation of it)

20 November 2009

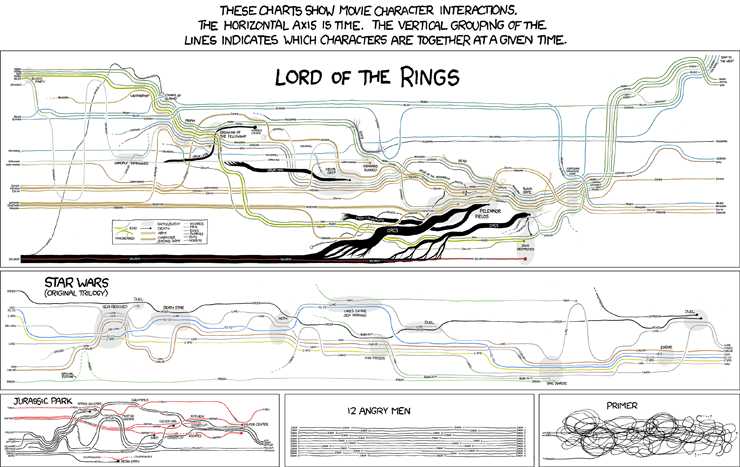
Good charts and humor?


XKCD.com  often delivers amusement, but now I get to include it on my business blog - look: charts and humor all in one place. Could it get any better (rhetorical).

Excel 2010 in-cell bar charts (are much better)

I've posted before on my opinions about Excel 2007's in-cell bar charts, and mentioned that Excel 2010's are supposed to be much better. Well, having got my hands on the beta version yesterday, I can say yes, yes, yes, they are much better. The gradient option is still there, but is not a default. Zero, and very low numbers compared to other numbers in the range have no bar height (see examples A and B below), AND there's no option to turn on the fake bar height.


Negative numbers in a range result in an axis being drawn, and the bar appearing the other side of the axis, in a different color (D). You have full control of colors of the axis and bars. But, wait, there's more. You can control the max and min of the chart - great if you have multiple in-cell bar chart ranges that you want to be able to compare.

You can't have the bars offset from the data as they are a conditional format, but you could just slap in a formula where you want the bar: "=cell where the data is", and then click the option to show just the bar, not the data (E). Even the gradient option is better, as there is a border by default allowing you to see where the end of the bar is (C). Finally, the resolution of the bar (i.e. when a bar height goes to zero), depends on the width of the cell (B). Great job Microsoft.

19 November 2009

You shouldn't notice good design

Sometimes software design and data visualizations wow us with their grace and beauty. I would argue though, for most of the time, we don't even notice when something just works in the way it should. Quick example - if you have multiple tabs open in Google's Chrome browser and you close a tab using the x on the tab, the next tab slides across and places the next x right under your mouse, so that you quickly can close the next as well.  But here's the great thing - if you have lots of tabs open so that they have been squeezed up, and close multiple tabs, it will wait before resizing the tab so that you can continue to close tabs without moving the mouse

Firefox sort of does this except when it comes to delaying the tab resize. Internet Explorer makes no attempt to decrease your mouse movements. Little things...

ShareThis